Examples

This example gallery includes a variety of examples for using pyrolite which you can copy, download and alter, or run on Binder.

Plotting Examples

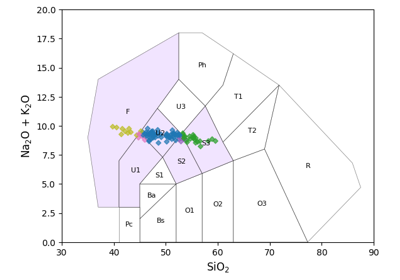
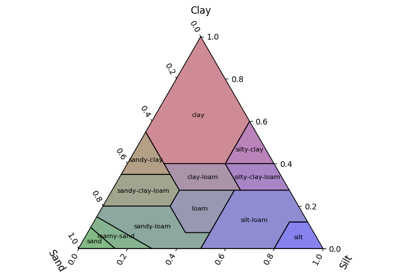
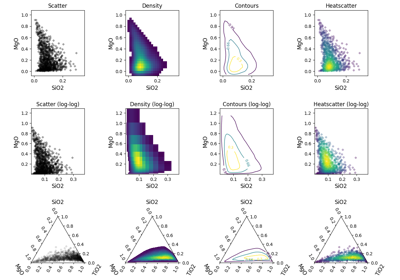
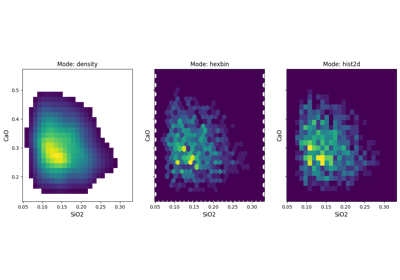
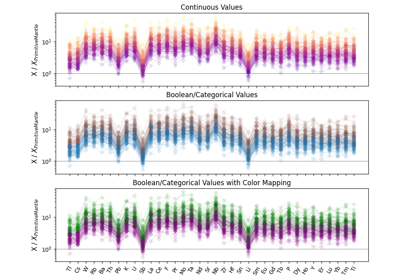
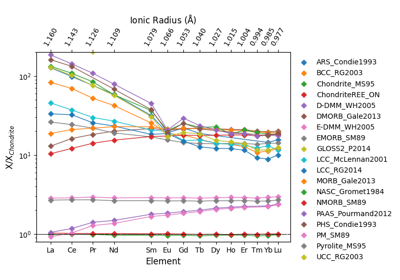
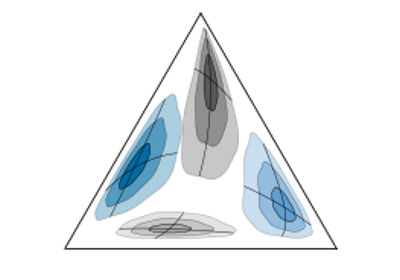
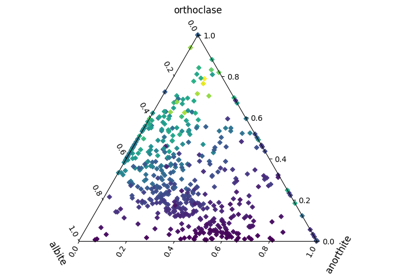
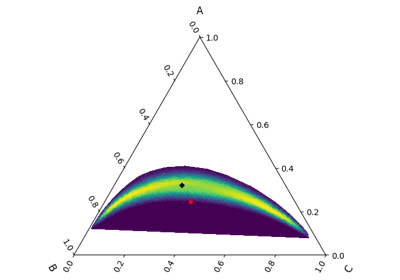
pyrolite provides some functionality for basic plotting of geochemical data in the form of spidergrams (pyrolite.plot.spider), ternary diagrams (pyrolite.plot.tern) and density diagrams (i.e. 2D histograms, pyrolite.plot.density).

Stem Plots

Stem Plots

Ternary Plots

Ternary Plots

REE Radii Plots

REE Radii Plots

Ternary Color Systems

Ternary Color Systems

Parallel Coordinate Plots

Parallel Coordinate Plots

Heatscatter Plots

Heatscatter Plots

Plot Templates

Plot Templates

Density and Contour Plots

Density and Contour Plots

Spiderplots & Density Spiderplots

Spiderplots & Density Spiderplots

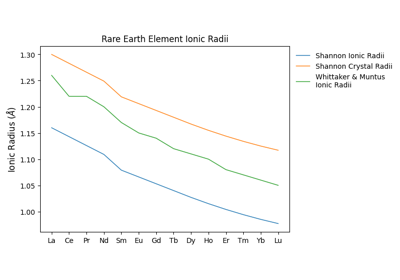
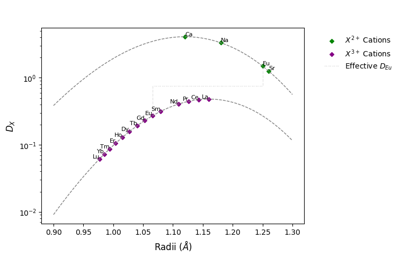
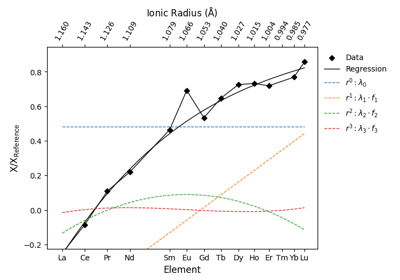
Geochemistry Examples

Mineral Database

Mineral Database

Element-Oxide Transformation

Element-Oxide Transformation

Normalization

Normalization

Geochemical Indexes and Selectors

Geochemical Indexes and Selectors

Mineral Endmember Decomposition

Mineral Endmember Decomposition

Ionic Radii

Ionic Radii

Unit Scaling

Unit Scaling

Lattice Strain Calculations

Lattice Strain Calculations

CIPW Norm

CIPW Norm

lambdas: Parameterising REE Profiles

lambdas: Parameterising REE Profiles

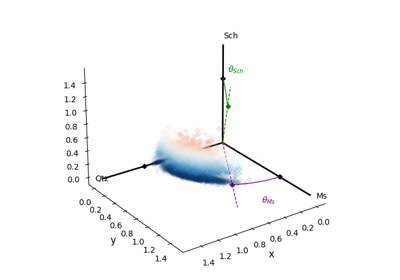
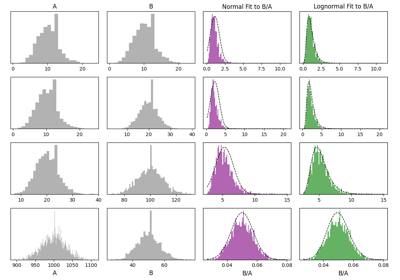
Compositional Data Examples

Log-transforms

Log-transforms

Spherical Coordinate Transformations

Spherical Coordinate Transformations

Log Ratio Means

Log Ratio Means

Compositional Data?

Compositional Data?

Utility Examples

pyrolite includes a range of utilities for everything from dealing with the web to plotting, synthetic data and machine learning. While most of these are used as part of the core functions of pyrolite, you may also find other uses for them, and this section provides some simple examples for some of these.

Using Manifolds for Visualisation

Using Manifolds for Visualisation

TAS Classifier

TAS Classifier

Geological Timescale

Geological Timescale