Ternary Plots
import matplotlib.pyplot as plt
import numpy as np
import pandas as pd

from pyrolite.plot import pyroplot

np.random.seed(82)
Let’s first create some example data:
df = pd.DataFrame(data=np.exp(np.random.rand(100, 3)), columns=["SiO2", "MgO", "CaO"])
df.loc[:, ["SiO2", "MgO", "CaO"]].head()
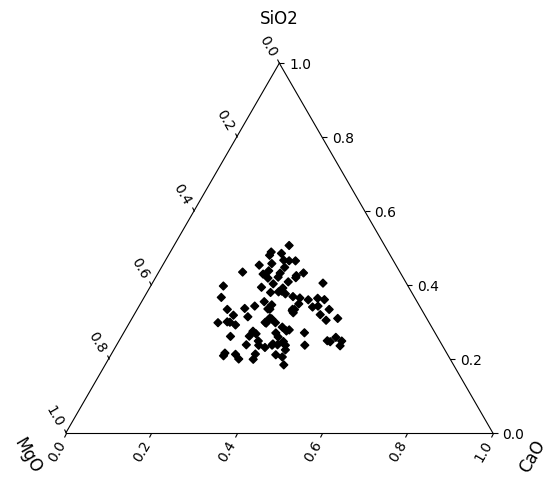
Now we can create a simple scatter plot:
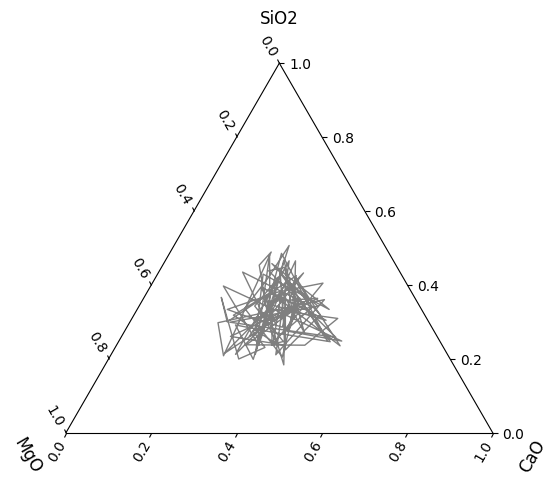
If the data represent some continuous series, you could also plot them as lines:
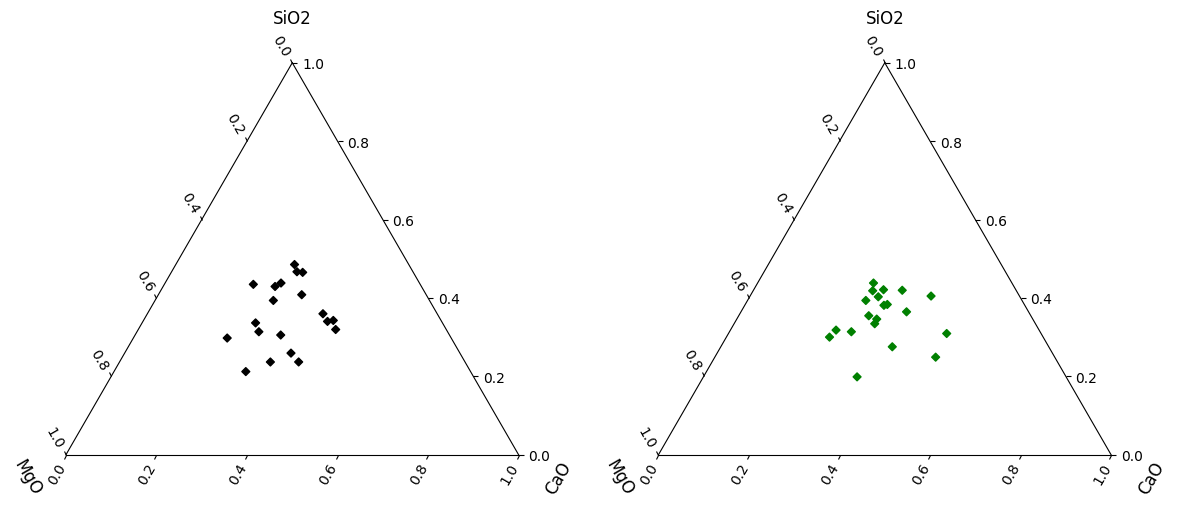
The plotting axis can be specified to use exisiting axes:
fig, ax = plt.subplots(1, 2, sharex=True, sharey=True, figsize=(12, 5))

df.loc[:, ["SiO2", "MgO", "CaO"]].sample(20).pyroplot.scatter(ax=ax[0], c="k")
df.loc[:, ["SiO2", "MgO", "CaO"]].sample(20).pyroplot.scatter(ax=ax[1], c="g")

ax = fig.orderedaxes  # creating scatter plots reorders axes, this is the correct order
plt.tight_layout()
Total running time of the script: (0 minutes 2.686 seconds)