Stem Plots
Stem plots are commonly used to visualise discrete distributions of data, and are useful to highlight discrete observations where the precision of values along one axis is high (e.g. an independent spatial measure like depth) and the other is less so (such that the sampling frequency along this axis is important, which is not emphasised by a scatter plot).
import matplotlib.pyplot as plt
import numpy as np
import pandas as pd

from pyrolite.plot import pyroplot
from pyrolite.plot.stem import stem


np.random.seed(82)
First let’s create some example data:
x = np.linspace(0, 10, 10) + np.random.randn(10) / 2.0
y = np.random.rand(10)
df = pd.DataFrame(np.vstack([x, y]).T, columns=["Depth", "Fe3O4"])
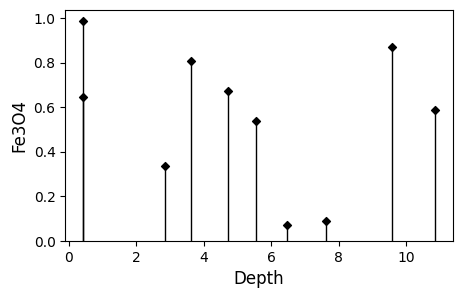
A minimal stem plot can be constructed as follows:
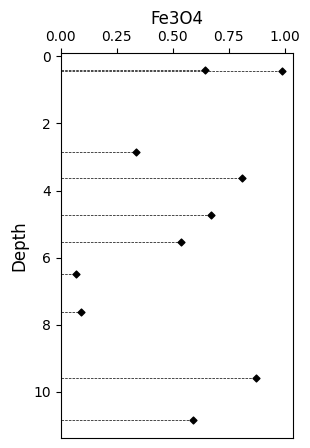
Stem plots can also be used in a vertical orientation, such as for visualising discrete observations down a drill hole:
ax = df.pyroplot.stem(
    orientation="vertical",
    s=12,
    linestyle="--",
    linewidth=0.5,
    color="k",
    figsize=(3, 5),
)
# the yaxes can then be inverted using:
ax.invert_yaxis()
# and if you'd like the xaxis to be labeled at the top:
ax.xaxis.set_ticks_position("top")
ax.xaxis.set_label_position("top")
Total running time of the script: (0 minutes 0.125 seconds)