REE Radii Plots
import matplotlib.pyplot as plt
import numpy as np
import pandas as pd

from pyrolite.plot import pyroplot
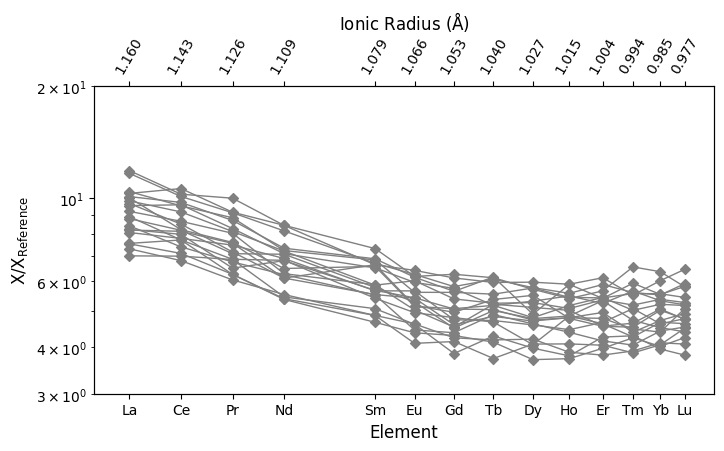
Here we generate some example data, using the
example_spider_data() function (based on EMORB,
here normalised to Primitive Mantle);
from pyrolite.util.synthetic import example_spider_data

df = example_spider_data(noise_level=0.1, size=20)
Where data is specified, the default plot is a line-based spiderplot:
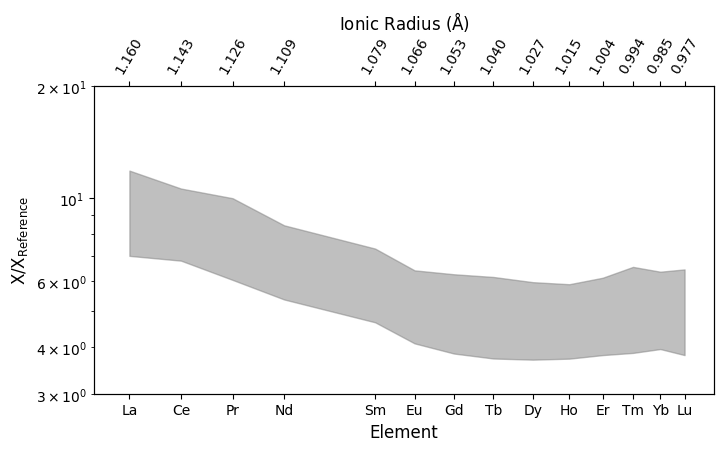
This behaviour can be modified (see spiderplot docs) to provide e.g. filled ranges:
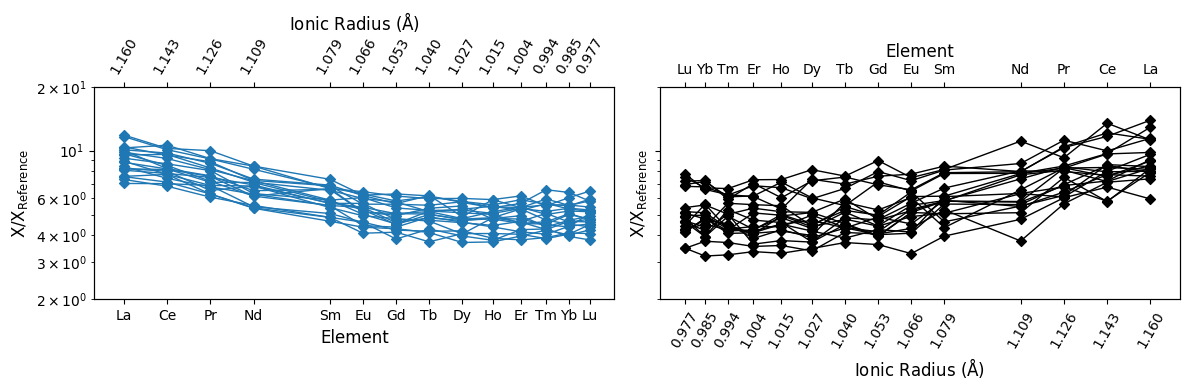
The plotting axis can be specified to use exisiting axes:
fig, ax = plt.subplots(1, 2, sharey=True, figsize=(12, 4))

df.pyroplot.REE(ax=ax[0])
# we can also change the index of the second axes
another_df = example_spider_data(noise_level=0.2, size=20)  # some 'nosier' data
another_df.pyroplot.REE(ax=ax[1], color="k", index="radii")

plt.tight_layout()
plt.show()
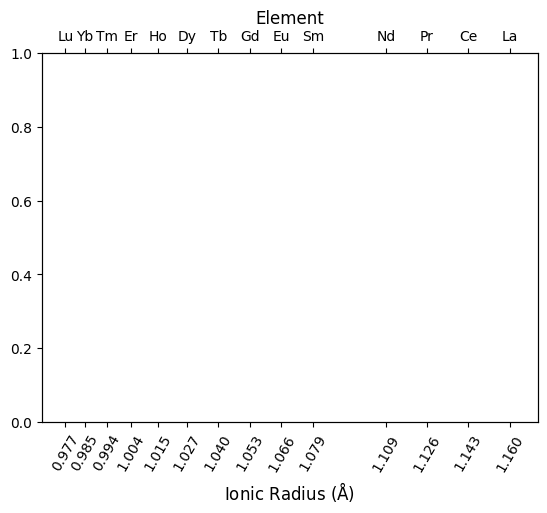
If you’re just after a plotting template, you can use
REE_v_radii() to get a formatted axis which can be used
for subsequent plotting:
from pyrolite.plot.spider import REE_v_radii

ax = REE_v_radii(index="radii")  # radii mode will put ionic radii on the x axis
plt.show()
See also
Total running time of the script: (0 minutes 1.065 seconds)