Ternary Color Systems
pyrolite includes two methods for coloring data points and polygons in
a ternary system, ternary_color() and
color_ternary_polygons_by_centroid() which work
well with some of the plot templates (pyrolite.plot.templates) and
associated classifiers (pyrolite.util.classification).
import numpy as np
import matplotlib.pyplot as plt
Colors by Ternary Position
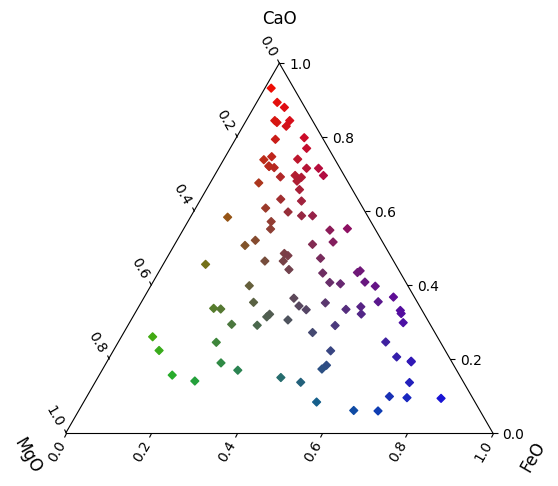
The ternary_color() function serves to generate
the color which correpsonds the the mixing of three colours in proportion
to the components in a ternary system. By default these colours are red, green
and blue (corresponding to the top, left, and right components in a terarny diagram).
The function returns colours in the form of an RGBA array:
from pyrolite.util.plot.style import ternary_color
from pyrolite.util.synthetic import normal_frame

# generate a synthetic dataset we can use for the colouring example
df = normal_frame(
    columns=["CaO", "MgO", "FeO"],
    size=100,
    seed=42,
    cov=np.array([[0.8, 0.3], [0.3, 0.8]]),
)

colors = ternary_color(df)
colors[:3]
array([[0.18902861, 0.54222697, 0.26874443, 0.999999  ],
       [0.5097609 , 0.16739226, 0.32284684, 0.999999  ],
       [0.08310658, 0.37115312, 0.54574029, 0.999999  ]])
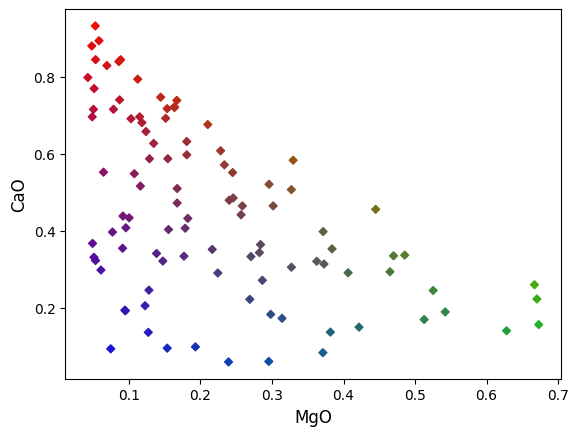
These can then be readily used in a ternary diagram (or eleswhere):
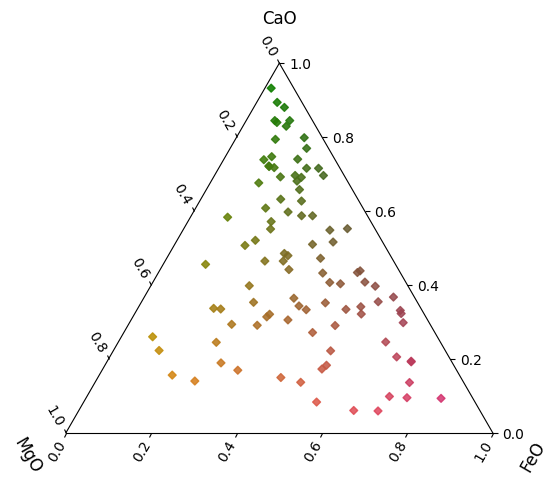
You can use different colors for each of the verticies if you so wish, and
mix and match named colors with RGB/RGBA represntations (note that the alpha will
be scaled, if it is passed as a keyword argument to
ternary_color()):
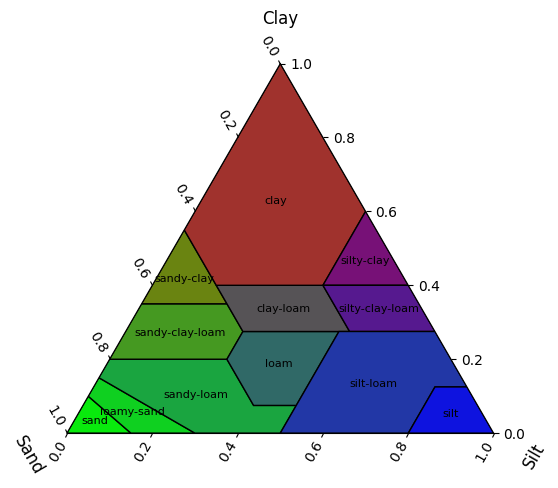
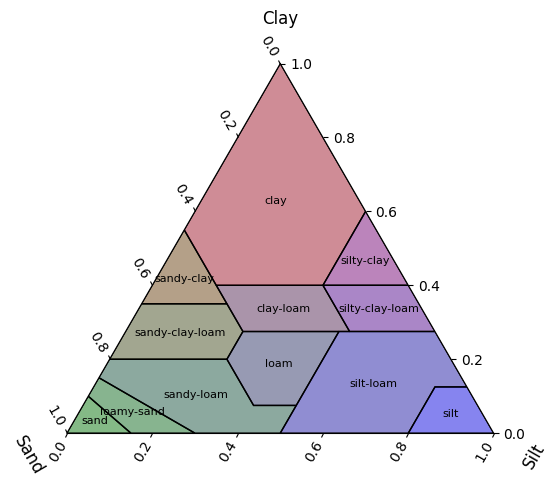
Colors by Centroid Position
We can also colour polygons within one of these templates by the ternary combination of colours (defaulting to red, green and blue) at the polygon centroid:
from pyrolite.util.classification import USDASoilTexture
from pyrolite.util.plot.style import color_ternary_polygons_by_centroid

clf = USDASoilTexture()
ax = clf.add_to_axes(ax=None, add_labels=True, figsize=(8, 8))
color_ternary_polygons_by_centroid(ax)
plt.show()
/home/docs/checkouts/readthedocs.org/user_builds/pyrolite/checkouts/main/pyrolite/comp/codata.py:43: UserWarning: Non-positive entries found. Closure operation assumes all positive entries.
  warnings.warn(
There are a range of options you can pass to this function to control the ternary colors (as above), change the scaling coefficients for ternary components and change the opacity of the colors:
color_ternary_polygons_by_centroid(
    ax, colors=("red", "green", "blue"), coefficients=(1, 1, 1), alpha=0.5
)
plt.show()
See also
- Examples:
Total running time of the script: (0 minutes 2.385 seconds)