Plot Templates
pyrolite includes some ready-made templates for well-known plots. These can
be used to create new plots, or add a template to an existing
matplotlib.axes.Axes.
import matplotlib.pyplot as plt
Bivariate Templates
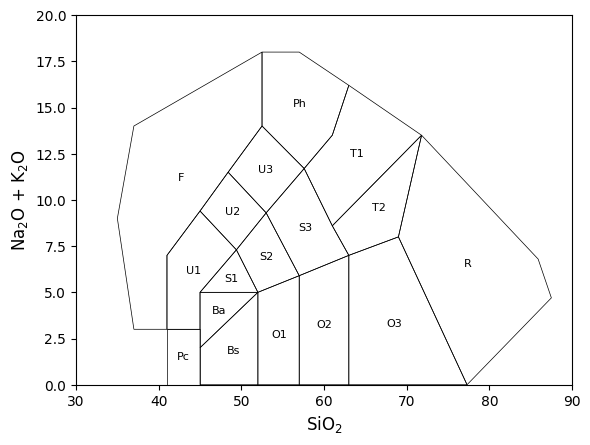
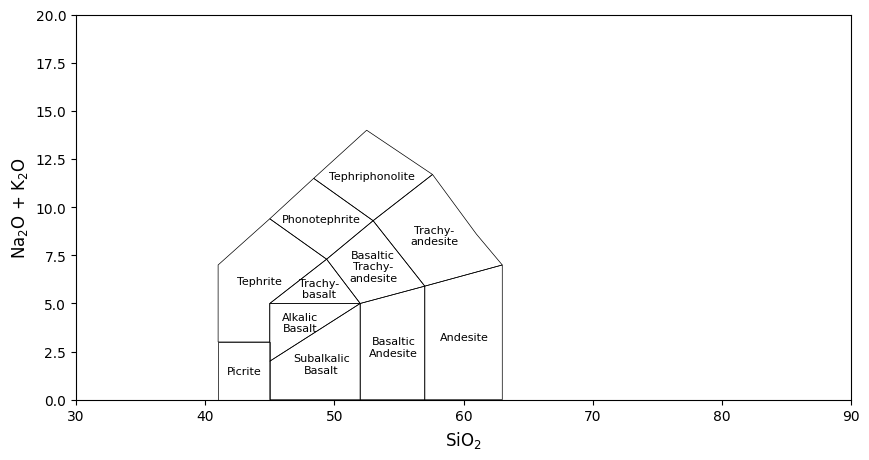
First let’s build a simple total-alkali vs silica (
TAS()) diagram:
from pyrolite.plot.templates import TAS, SpinelFeBivariate
from pyrolite.util.plot.axes import share_axes


ax = TAS(linewidth=0.5, add_labels=True)
plt.show()
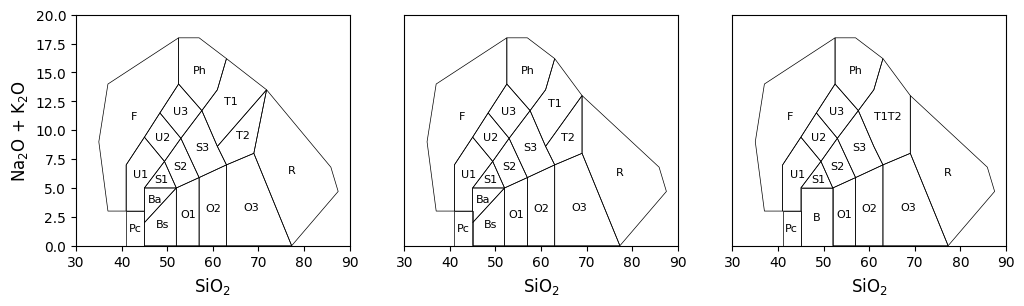
A few different variants are now available, with slightly different positioning of field boundaries, and with some fields combined:
fig, ax = plt.subplots(1, 3, figsize=(12, 3))

TAS(ax=ax[0], linewidth=0.5, add_labels=True, which_model=None)  # Middlemost's TAS
TAS(ax=ax[1], linewidth=0.5, add_labels=True, which_model="LeMaitre")  # LeMaitre's TAS
TAS(ax=ax[2], linewidth=0.5, add_labels=True, which_model="LeMaitreCombined")

for a in ax[1:]:
    a.set(yticks=[], ylabel=None)
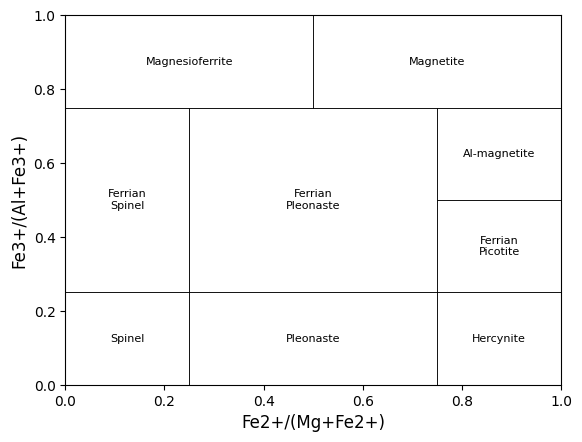
For distinguishing Fe-rich variants of spinel phases, the bivariate spinel diagram can be useful:
ax = SpinelFeBivariate(linewidth=0.5, add_labels=True)
plt.show()
/home/docs/checkouts/readthedocs.org/user_builds/pyrolite/checkouts/main/pyrolite/util/plot/axes.py:220: RuntimeWarning: More than 20 figures have been opened. Figures created through the pyplot interface (`matplotlib.pyplot.figure`) are retained until explicitly closed and may consume too much memory. (To control this warning, see the rcParam `figure.max_open_warning`). Consider using `matplotlib.pyplot.close()`.
  fig, ax = plt.subplots(1, **subkwargs(kwargs, plt.subplots, plt.figure))
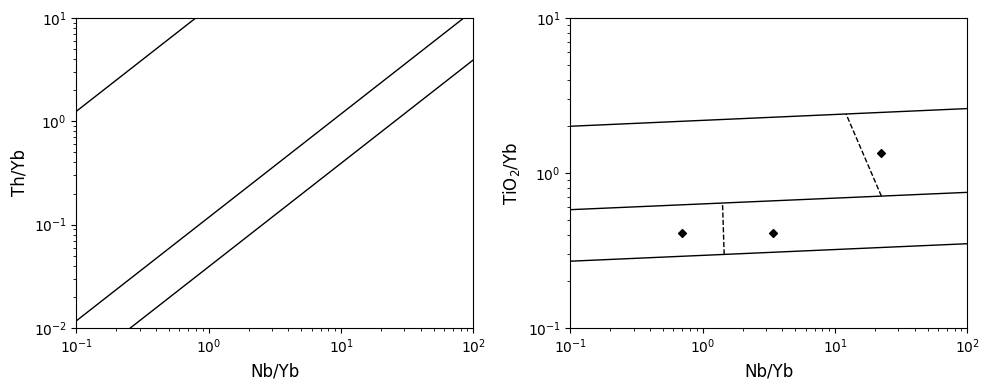
pyrolite contains templates for the Pearce diagrams, used to discriminate mafic rocks
(and particularly basalts) based on their whole-rock geochemistry. Two templates are
included: pearceThNbYb() and
pearceTiNbYb().
We can create some axes and add these templates to them:
from pyrolite.plot.templates import pearceThNbYb, pearceTiNbYb

fig, ax = plt.subplots(1, 2, figsize=(10, 4))
share_axes(ax, which="x")  # these diagrams have the same x axis

pearceThNbYb(ax=ax[0])
pearceTiNbYb(ax=ax[1])

plt.tight_layout()  # nicer spacing for axis labels
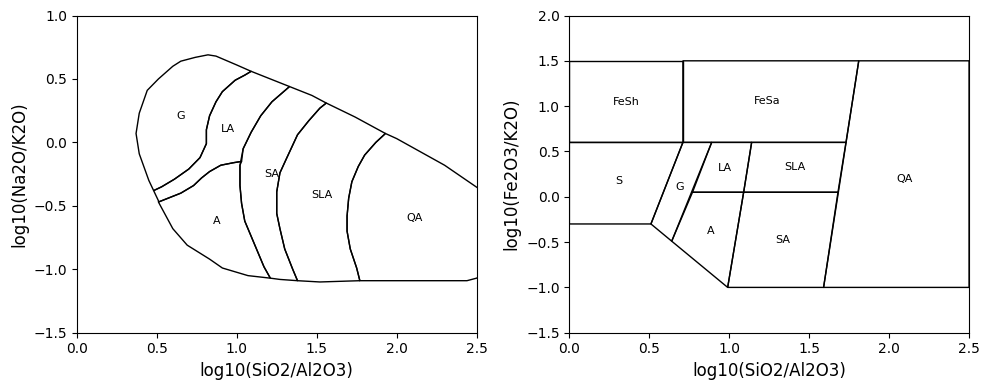
pyrolite also now includes some diagram templates for discrimination of sandstones
based on their whole-rock geochemistry (Pettijohn(),
Herron()):
from pyrolite.plot.templates import Herron, Pettijohn

fig, ax = plt.subplots(1, 2, figsize=(10, 4))
share_axes(ax, which="x")  # these diagrams have the same x axis

Pettijohn(ax=ax[0], add_labels=True)
Herron(ax=ax[1], add_labels=True)

plt.tight_layout()
Ternary Templates
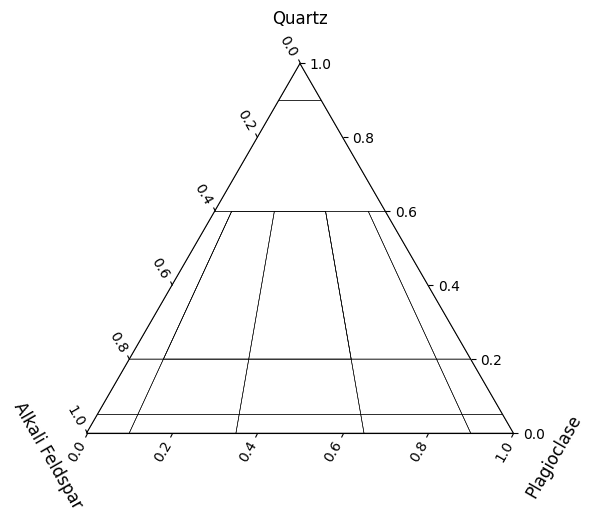
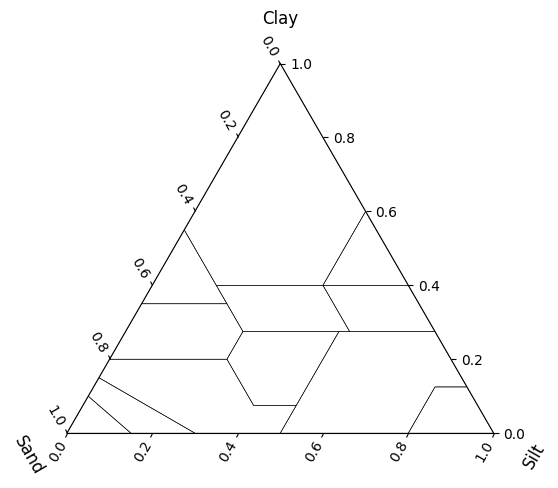
pyrolite now also includes ternary classification diagrams inlcuding
the QAP() and
USDASoilTexture() diagrams:
from pyrolite.plot.templates import (
    QAP,
    FeldsparTernary,
    JensenPlot,
    SpinelTrivalentTernary,
    USDASoilTexture,
)

ax = QAP(linewidth=0.4)
plt.show()
/home/docs/checkouts/readthedocs.org/user_builds/pyrolite/checkouts/main/pyrolite/comp/codata.py:43: UserWarning: Non-positive entries found. Closure operation assumes all positive entries.
  warnings.warn(
ax = USDASoilTexture(linewidth=0.4)
plt.show()
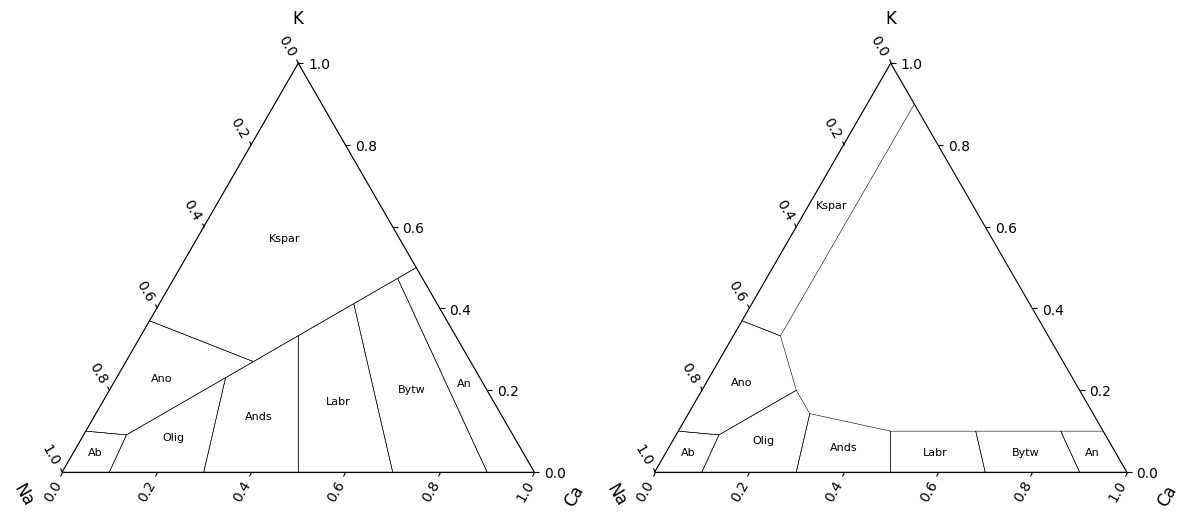
For the feldspar ternary diagram, which is complicated by a miscibility gap, there are two modes: ‘default’ and ‘miscibility-gap’. The second of these provides a simplified approximation of the miscibility gap between k-feldspar and plagioclase, wheras ‘default’ ignores this aspect (which itself is complicated by temperature):
fig, ax = plt.subplots(1, 2, figsize=(12, 6))
FeldsparTernary(ax=ax[0], linewidth=0.4, add_labels=True, mode="default")
FeldsparTernary(ax=ax[1], linewidth=0.4, add_labels=True, mode="miscibility-gap")
plt.tight_layout()
plt.show()
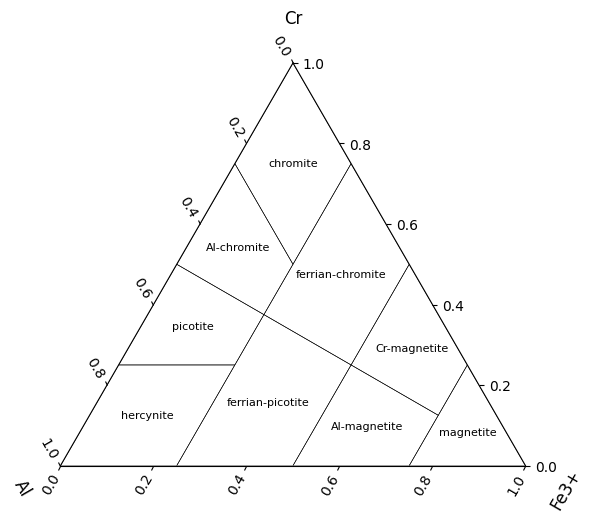
For general spinel phase discrimination, a ternary classification diagram can be used to give labels based on trivalent cationic content (\(\mathrm{Cr^{3+}}\), \(\mathrm{Al^{3+}}\), \(\mathrm{Fe^{3+}}\)):
SpinelTrivalentTernary(linewidth=0.4, add_labels=True, figsize=(6, 6))
plt.show()
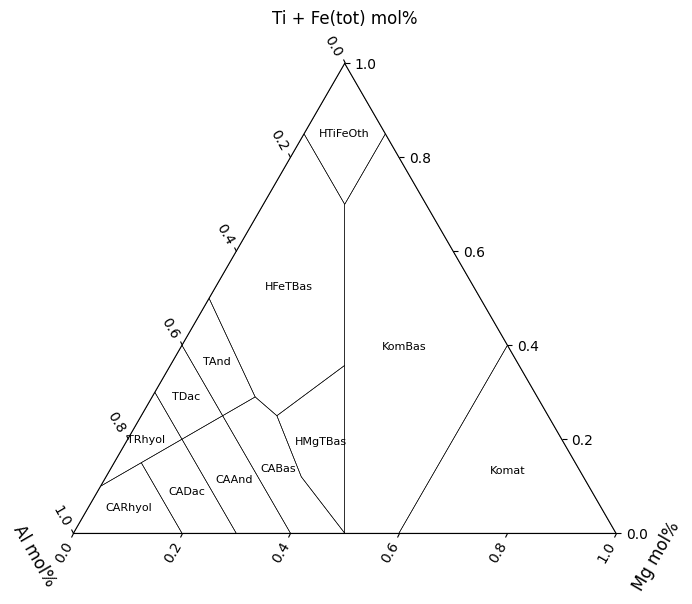
The Jensen plot is another cationic ternary discrimination diagram (Jensen, 1976), for subalkaline volcanic rocks:
JensenPlot(linewidth=0.4, add_labels=True, figsize=(6,6))
plt.show()
Customization - Labelling Schemes and Field Subsets
For most templates, you’re able to customize which labels are applied to each field. This includes swapping between the ‘ID’ and the ‘name’ (and for TAS, swapping between intrusive and volcanic equivalents), as well as specifing that only fields with specific IDs are added to the diagram. For example, here we add volcanic labels for a subset of fields in a TAS diagram (in this case, the LeMaitre version):
<Figure size 1000x500 with 1 Axes>
References and other notes for diagram templates can be found within the docstrings and within the pyrolite documentation:
help(TAS)
Help on function TAS in module pyrolite.plot.templates.TAS:

TAS(ax=None, add_labels=False, which_labels='ID', relim=True, color='k', which_model=None, **kwargs)
    Adds the TAS diagram to an axes. Diagram from Middlemost (1994) [#pyrolite.plot.templates.TAS.TAS_1]_,
    a closed-polygon variant after Le Bas et al (1992) [#pyrolite.plot.templates.TAS.TAS_2]_.

    Parameters
    ----------
    ax : :class:`matplotlib.axes.Axes`
        Axes to add the template on to.
    add_labels : :class:`bool`
        Whether to add labels at polygon centroids.
    which_labels : :class:`str`
        Which labels to add to the polygons (e.g. for TAS, 'volcanic', 'intrusive'
        or the field 'ID').
    relim : :class:`bool`
        Whether to relimit axes to fit the built in ranges for this diagram.
    color : :class:`str`
        Line color for the diagram.
    which_model : :class:`str`
        The name of the model variant to use, if not Middlemost.

    Returns
    -------
    ax : :class:`matplotlib.axes.Axes`

    References
    -----------
    .. [#pyrolite.plot.templates.TAS.TAS_1] Middlemost, E. A. K. (1994).
                Naming materials in the magma/igneous rock system.
                Earth-Science Reviews, 37(3), 215-224.
                doi: `10.1016/0012-8252(94)90029-9 <https://dx.doi.org/10.1016/0012-8252(94)90029-9>`__

    .. [#pyrolite.plot.templates.TAS.TAS_2] Le Bas, M.J., Le Maitre, R.W., Woolley, A.R. (1992).
                The construction of the Total Alkali-Silica chemical
                classification of volcanic rocks.
                Mineralogy and Petrology 46, 1-22.
                doi: `10.1007/BF01160698 <https://dx.doi.org/10.1007/BF01160698>`__
See also
- Examples:
- Modules:
- Classes:
Total running time of the script: (0 minutes 4.794 seconds)