Creating Plot Templates/Classifier Models
pyrolite provides a system for creating and using plot templates/classifier models
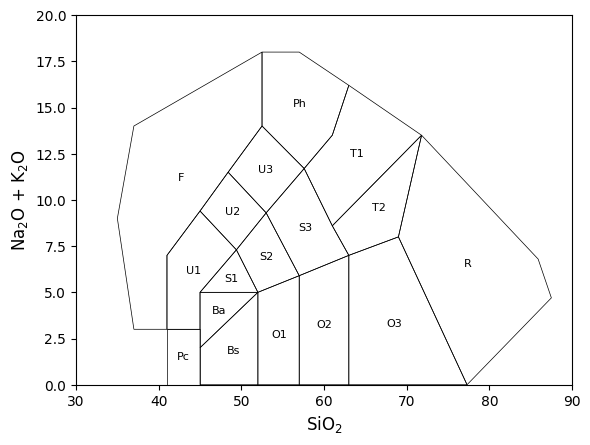
based on a series of polygons in variable space (e.g., the TAS diagram). A variety of
diagram templates/ classifiers
are available, but you can also create your own.
In this tutorial, we’ll go through the process of creating a diagram template from scratch, as a demonstration of how you might create your own for your use - or to later contribute to the collection in pyrolite.
The basis for most diagrams and classifiers is the class
PolygonClassifier; the docstring-based help
text is a good place to start to understand what we’ll need to put it together:
from pyrolite.util.classification import PolygonClassifier

help(PolygonClassifier)
Help on class PolygonClassifier in module pyrolite.util.classification:

class PolygonClassifier(builtins.object)
 |  PolygonClassifier(name=None, axes=None, fields=None, scale=1.0, transform=None, mode=None, **kwargs)
 |
 |  A classifier model built form a series of polygons defining specific classes.
 |
 |  Parameters
 |  -----------
 |  name : :class:`str`
 |      A name for the classifier model.
 |  axes : :class:`dict`
 |      Mapping from plot axes to variables to be used for labels.
 |  fields : :class:`dict`
 |      Dictionary describing indiviudal polygons, with identifiers as keys and
 |      dictionaries containing 'name' and 'fields' items.
 |  scale : :class:`float`
 |      Default maximum scale for the axes. Typically 100 (wt%) or 1 (fractional).
 |  xlim : :class:`tuple`
 |      Default x-limits for this classifier for plotting.
 |  ylim : :class:`tuple`
 |      Default y-limits for this classifier for plotting.
 |
 |  Methods defined here:
 |
 |  __init__(self, name=None, axes=None, fields=None, scale=1.0, transform=None, mode=None, **kwargs)
 |      Initialize self.  See help(type(self)) for accurate signature.
 |
 |  add_to_axes(self, ax=None, fill=False, axes_scale=1.0, add_labels=False, which_labels='ID', which_ids=None, **kwargs)
 |      Add the fields from the classifier to an axis.
 |
 |      Parameters
 |      ----------
 |      ax : :class:`matplotlib.axes.Axes`
 |          Axis to add the polygons to.
 |      fill : :class:`bool`
 |          Whether to fill the polygons.
 |      axes_scale : :class:`float`
 |          Maximum scale for the axes. Typically 100 (for wt%) or 1 (fractional).
 |      add_labels : :class:`bool`
 |          Whether to add labels for the polygons.
 |      which_labels : :class:`str`
 |          Which data to use for field labels - field 'name' or 'ID'.
 |      which_ids : :class:`list`
 |          List of field IDs corresponding to the polygons to add to the axes object.
 |          (e.g. for TAS, ['F', 'T1'] to plot the Foidite and Trachyte fields).
 |          An empty list corresponds to plotting all the polygons.
 |
 |      Returns
 |      --------
 |      ax : :class:`matplotlib.axes.Axes`
 |
 |  predict(self, X, data_scale=None)
 |      Predict the classification of samples using the polygon-based classifier.
 |
 |      Parameters
 |      -----------
 |      X : :class:`numpy.ndarray` | :class:`pandas.DataFrame`
 |          Data to classify.
 |      data_scale : :class:`float`
 |          Maximum scale for the data. Typically 100 (wt%) or 1 (fractional).
 |
 |      Returns
 |      -------
 |      :class:`pandas.Series`
 |          Series containing classifer predictions. If a dataframe was input,
 |          it inherit the index.
 |
 |  ----------------------------------------------------------------------
 |  Readonly properties defined here:
 |
 |  axis_components
 |      Get the axis components used by the classifier.
 |
 |      Returns
 |      -------
 |      :class:`tuple`
 |          Ordered names for axes used by the classifier.
 |
 |  ----------------------------------------------------------------------
 |  Data descriptors defined here:
 |
 |  __dict__
 |      dictionary for instance variables
 |
 |  __weakref__
 |      list of weak references to the object
The key things you’ll need to construct a classifer are:
a name
a specification of what the axes correspond to,
and a dictionary of fields (dictionaries containing a ‘name’ and coordinates defining the polygon).
We can also optionally specify the x and y limits, which are specific to plotting.
Here we’ll put together a simple classifier model with just two fields,
and add this to a matplotlib axis. You can optionally specify names/labels for each field, here we opt to just use some basic IDs (A and B), so these are what will be added to the plot:
clf = PolygonClassifier(
    name="DemoClassifier",
    axes={"x": "SiO2", "y": "MgO"},
    fields={
        "A": {
            "poly": [[0, 75], [0, 100], [50, 100], [50, 75]],
        },
        "B": {
            "poly": [[0, 25], [0, 75], [25, 75], [25, 25]],
        },
    },
    xlim=(0, 100),
    ylim=(0, 100),
)
ax = clf.add_to_axes(add_labels=True)
ax.figure
<Figure size 640x480 with 1 Axes>
While we’re individually passing each of these arguments to
PolygonClassifier, we can also pass a dictionary
of keyword arguments:
cfg = dict(
    name="DemoClassifier",
    axes={"x": "SiO2", "y": "MgO"},
    fields={
        "A": {
            "poly": [[0, 75], [0, 100], [50, 100], [50, 75]],
        },
        "B": {
            "poly": [[0, 25], [0, 75], [25, 75], [25, 25]],
        },
    },
    xlim=(0, 100),
    ylim=(0, 100),
)

clf = PolygonClassifier(**cfg)
Each of the built-in models are saved as JSON files, and loaded in a manner as above;
we can replicate that here - saving our configuration to JSON then loading it up again.
We’ll use a temporary directory here, but you can save it wherever you like (note the
pyrolite templates live under /data/models in the repository); once you’ve
got a template working how you’d like, consider
submitting it!
import json

from pyrolite.util.general import temp_path

tmp = temp_path()
with open(tmp / "demo_classifier.json", "w") as f:
    f.write(json.dumps(cfg))


with open(tmp / "demo_classifier.json", "r") as f:
    clf = PolygonClassifier(**json.load(f))

clf.add_to_axes(add_labels=True).figure
<Figure size 640x480 with 1 Axes>
Ternary Templates
While it’s slightly more work, you can also generate ternary templates using a very simliar pattern to the bivariate ones above. The principal differences are that you’ll need to specify three axes (t, l, r), specify a ‘ternary’ transform, and have coordinates for polygons in the ternary space - each with three values. For example, here are two fields from the UDSA soil texture triangle:
cfg = {
    "axes": {"t": "Clay", "l": "Sand", "r": "Silt"},
    "transform": "ternary",
    "fields": {
        "sand": {"name": "Sand", "poly": [[0, 100, 0], [10, 90, 0], [0, 85, 15]]},
        "loamy-sand": {
            "name": "Loamy Sand",
            "poly": [[10, 90, 0], [0, 85, 15], [0, 70, 30], [15, 85, 0]],
        },
    },
}
PolygonClassifier(**cfg).add_to_axes(add_labels=True).figure
/home/docs/checkouts/readthedocs.org/user_builds/pyrolite/checkouts/main/pyrolite/comp/codata.py:43: UserWarning: Non-positive entries found. Closure operation assumes all positive entries.
  warnings.warn(

<Figure size 640x480 with 1 Axes>
Total running time of the script: (0 minutes 0.674 seconds)